The following text was automatically extracted from the image on this page using optical character recognition software:
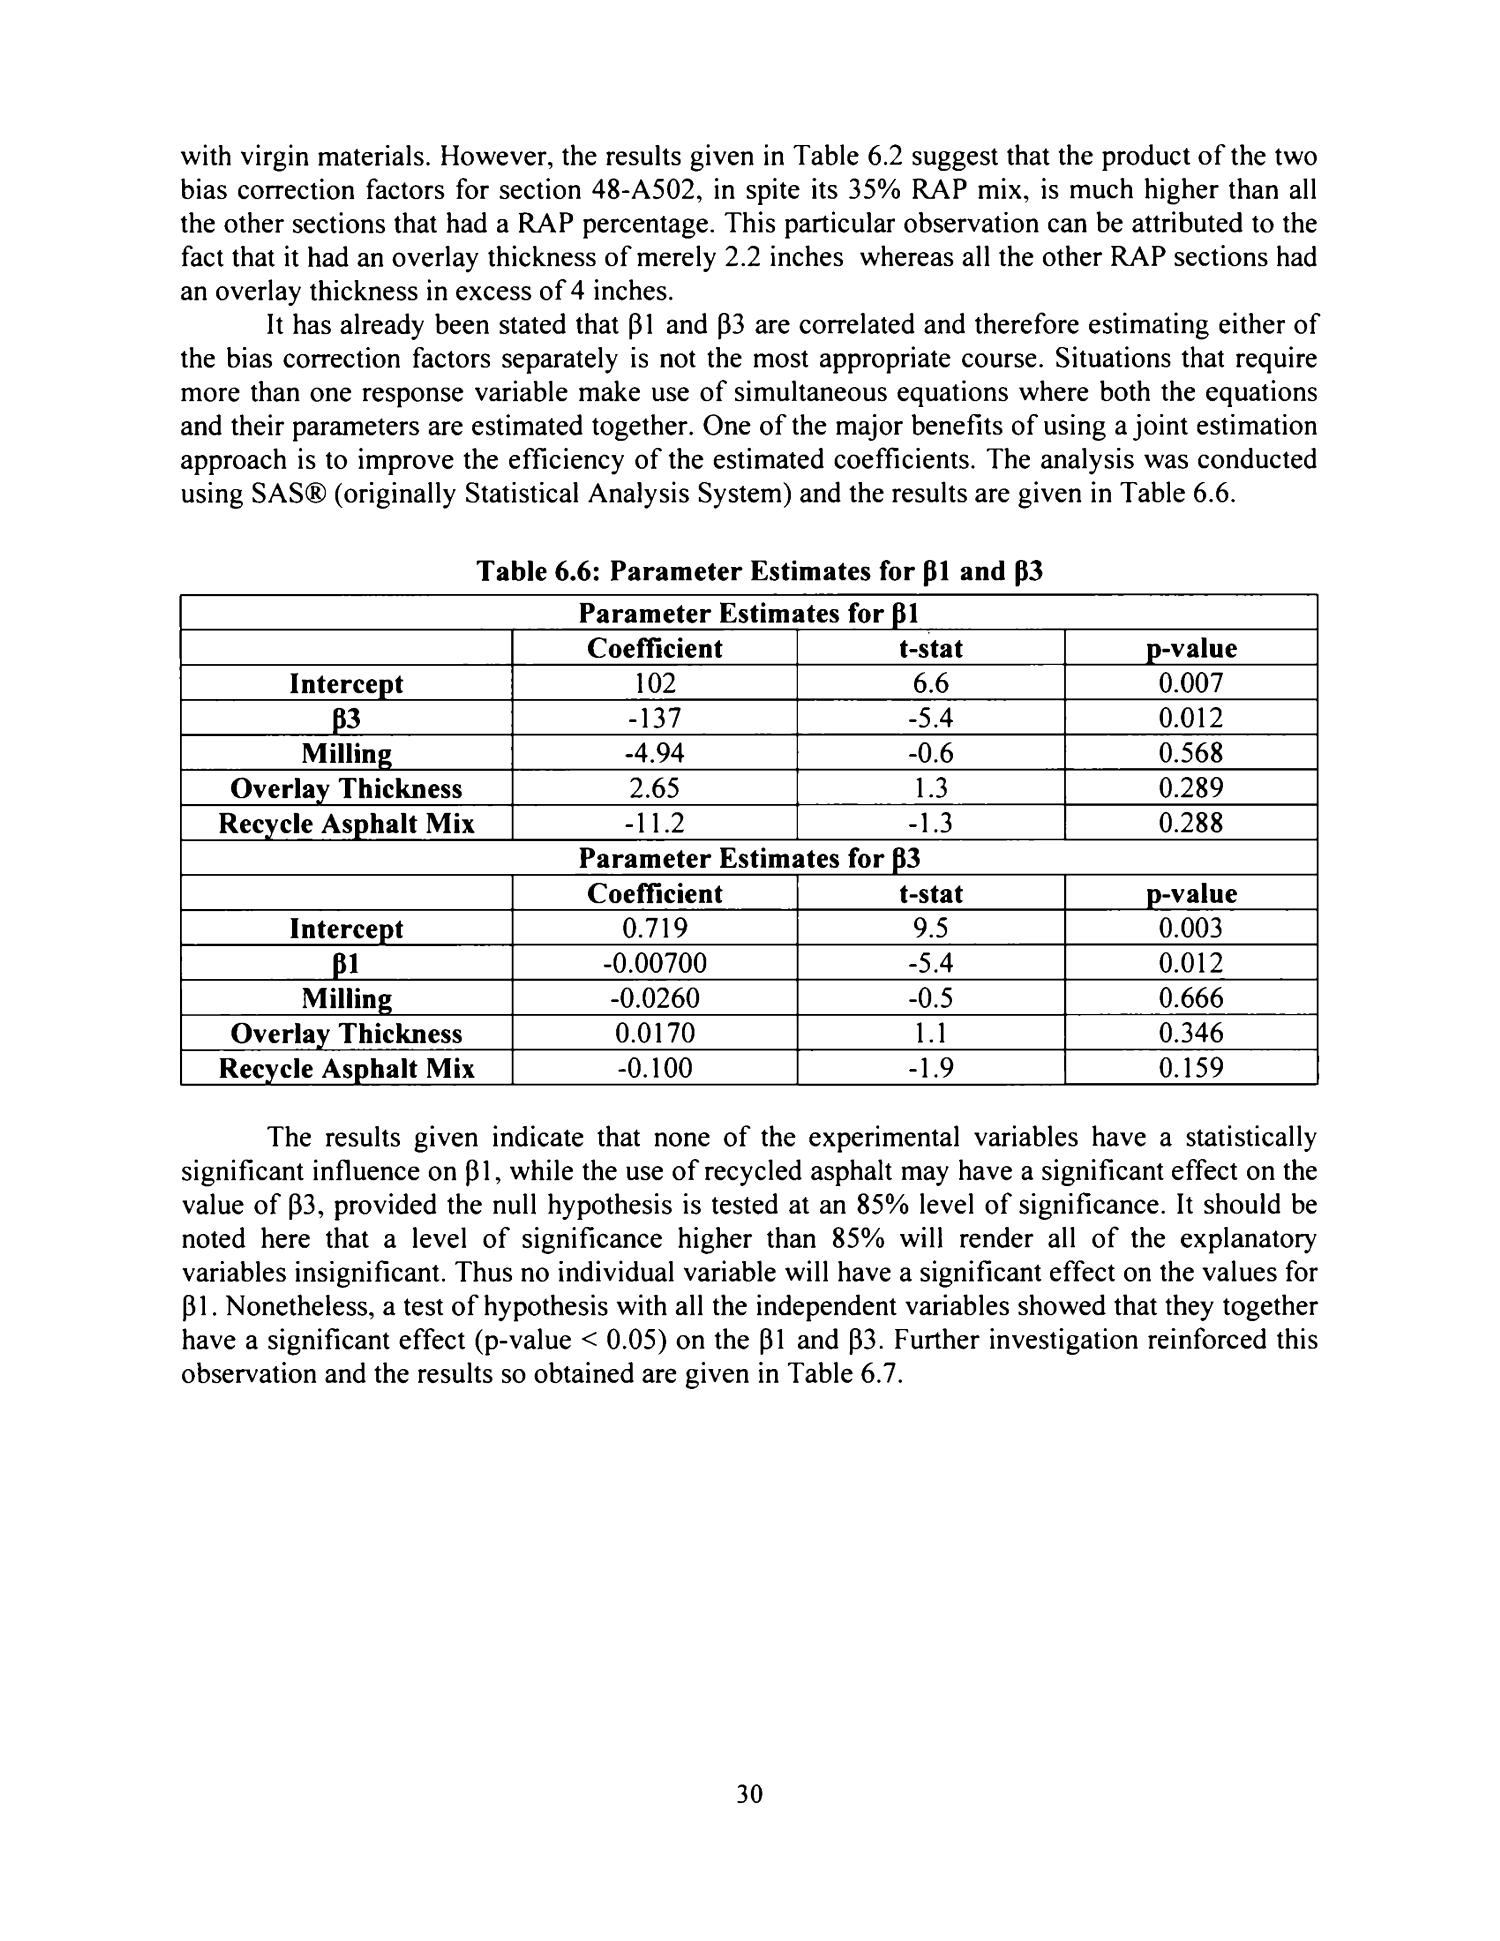
with virgin materials. However, the results given in Table 6.2 suggest that the product of the two bias correction factors for section 48-A502, in spite its 35% RAP mix, is much higher than all the other sections that had a RAP percentage. This particular observation can be attributed to the fact that it had an overlay thickness of merely 2.2 inches whereas all the other RAP sections had an overlay thickness in excess of 4 inches. It has already been stated that 11 and 13 are correlated and therefore estimating either of the bias correction factors separately is not the most appropriate course. Situations that require more than one response variable make use of simultaneous equations where both the equations and their parameters are estimated together. One of the major benefits of using a joint estimation approach is to improve the efficiency of the estimated coefficients. The analysis was conducted using SAS (originally Statistical Analysis System) and the results are given in Table 6.6. Table 6.6: Parameter Estimates for l1 and P3 Parameter Estimates for P1 Coefficient t-stat p-value Intercept 102 6.6 0.007 13 -137 -5.4 0.012 Milling -4.94 -0.6 0.568 Overlay Thickness 2.65 1.3 0.289 Recycle Asphalt Mix -11.2 -1.3 0.288 Parameter Estimates for [3 Coefficient t-stat p-value Intercept 0.719 9.5 0.003 P11 -0.00700 -5.4 0.012 Milling -0.0260 -0.5 0.666 Overlay Thickness 0.0170 1.1 0.346 Recycle Asphalt Mix -0.100 -1.9 0.159 The results given indicate that none of the experimental variables have a statistically significant influence on 131, while the use of recycled asphalt may have a significant effect on the value of 133, provided the null hypothesis is tested at an 85% level of significance. It should be noted here that a level of significance higher than 85% will render all of the explanatory variables insignificant. Thus no individual variable will have a significant effect on the values for 131. Nonetheless, a test of hypothesis with all the independent variables showed that they together have a significant effect (p-value < 0.05) on the 131 and 13. Further investigation reinforced this observation and the results so obtained are given in Table 6.7.
Banerjee, Ambarish; Aguiar-Moya, José Pablo; Sivaram, Prasad; Smit, Andre de F. & Prozzi, Jorge Alberto.Project Report on the Continued Development and Analysis of the Flexible Pavements Database,
report,
February 2011;
Austin, Texas.
(https://texashistory.unt.edu/ark:/67531/metapth281719/m1/44/?rotate=270:
accessed July 16, 2024),
University of North Texas Libraries, The Portal to Texas History, https://texashistory.unt.edu;
crediting UNT Libraries Government Documents Department.
